
● careerMar 2023 — Sep 2023
Detecting pedestrians in raw infrared
- role
- Engineering intern, computer vision
- company
- GIPSA-lab · Deep Red chair (Lynred)
- location
- Grenoble, France
- tools
- Python
- PyTorch
- YOLOv8
- Torchvision
- Docker
- Singularity
Context
A six-month final internship, from March to September 2023, at GIPSA-lab, a Grenoble research lab of CNRS, Grenoble INP and UGA. The subject belongs to the Deep Red industrial chair, created in 2022 on the initiative of Lynred, a world leader in infrared sensors, and backed by the Grenoble INP foundation. Its aim: get the most out of infrared sensors with artificial intelligence.
Why infrared?
Every object above absolute zero emits infrared radiation, more strongly the hotter it is. The infrared spectrum splits into three bands: near and short waves (NIR/SWIR), mid waves (MWIR) and long waves (LWIR). Lynred's thermal sensors work in the long waves: they see heat, not light.

For cars, thermal infrared sees what ordinary cameras miss: at night, through fog or smoke, without being dazzled by headlights or a tunnel exit, and without mistaking a poster for a pedestrian. On the KAIST dataset, the same model detects pedestrians better at night in infrared (49.3%) than in visible light (44.1%).

The problem
Straight out of the sensor, infrared images are very noisy: pixel non-uniformity, electronics, stray flux. They are coded on 16 bits, 65,536 shades of temperature, which must be tone-mapped down to 8 bits for a screen or an eye to read them.


Lynred cleans these images with a long correction chain: non-uniformity correction (NUC), destriping, bad pixel replacement (BPR), tone mapping. It works, but it is costly: calibration depends on the sensor's temperature, which drifts during use.

How far can these corrections be cut, down to working on the raw images directly, while still detecting pedestrians in real time, with a model light enough to ride in a car?
What I built
A complete, configurable pipeline to run dozens of experiments: read the 16-bit raw frames, apply each correction or not, build the dataset, train the model, quantise it, then evaluate it and look at its predictions. Every block is independent and driven by a single main script.
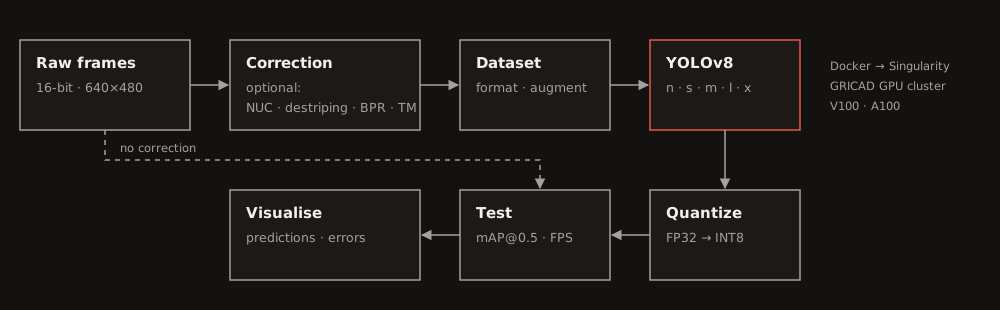
After a review of the state of the art, I picked YOLOv8, brand new at the time, for its balance of accuracy and speed and its five model sizes. Training ran on GRICAD, UGA's computing infrastructure (V100 and A100 GPUs): each experiment was packaged as a Docker image, converted to Singularity for the cluster, then submitted as a job.

Experiments
First run on fully corrected images: 46.2% mAP@0.5 with the smallest model, YOLOv8n, against 30.7% for the previous intern's model, at 6.3 ms per frame, about 158 frames per second.

Error analysis drove fixes to the dataset: unlabelled pedestrians were added, a detection inside a “group” box counts as a true positive, and pedestrians under 20 pixels tall are left out, too far away to be an immediate danger.

Calibration and temperature
Non-uniformity correction relies on a calibration frame taken at a given ambient temperature. I measured the effect of a gap between that temperature and the sensor's: while the sensor is warmer than the calibration, accuracy holds; the other way round, it collapses as the gap widens. Lynred's experience was confirmed.


Raw frames
On raw frames, the model dropped to 27.8%. The idea that changed everything: a network reads three colour channels, while an infrared image has only one, copied three times. I used the spare channels to pass information to the model: the sensor's temperature, or a calibration frame.
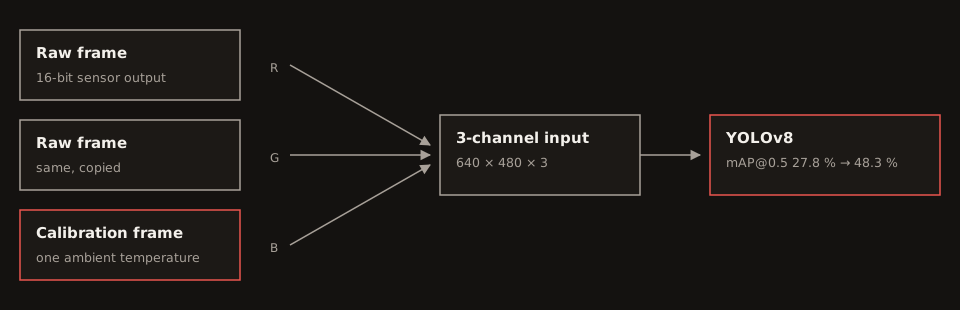
def fuse_channels(raw: np.ndarray, calibration: np.ndarray) -> np.ndarray:
    """A 16-bit raw frame and a calibration frame as one 3-channel input.

    The calibration goes on the third channel: YOLOv8 normalises each channel
    on its own, and that position gave the best results.
    """
    return np.dstack((raw, raw, calibration))  # 640 × 480 × 3
With a calibration frame matched to each image, the model reaches 48.3% on raw frames, better than the first run on corrected images. To cut the cost further, a single calibration frame for the whole dataset gives 37%.
More data
YOLOv8's built-in data augmentation did nothing for these images. So I wrote my own augmentations with Torchvision (flip, perspective, shear, rotation, translation, scaling, a revisited CutOut), recomputing the ground-truth boxes each time.


I also generated synthetic images for fine-tuning, and tried multiclass detection: cars 78%, pedestrians 70%, two-wheelers 35%, the latter being too rare in the dataset.
Outcome
The final evaluation compares the five YOLOv8 sizes on three datasets: corrected and tone-mapped frames, calibrated-only frames, and raw frames with a calibration frame. About 10 points separate the best model on corrected images from the best on raw ones. INT8 quantisation cuts inference time by two to three for 5 to 9 points of mAP, and every model holds real time on GPU, even YOLOv8x at about 20 frames per second.

Two of the previous year's conclusions fell: tone mapping is no longer required, and raw frames now give usable results. The model also generalises beyond Lynred's data: 81.8% to 84.0% mAP@0.5 on the public CVC-14 dataset. The code, a technical note and the report went to the chair, where a postdoc took the subject over in autumn 2023, with a clear lead: a multimodal model, designed for infrared, that also reads the sensor's temperature.